
We are all in online forums with endless discussions about everything related to the current coronavirus situation. My college (IIT Delhi) group is no exception – what is far more interesting is that every once in a while, we go down analysis rabbit holes on a variety of topics: economics, math etc. This post is inspired by one such discussion that got me thinking about how often we fall into the trap of literal interpretations of data and more importantly, how to navigate the world when you don’t have data. Takes us back to where I left off last week – how can we model the real world and simulate different scenarios?
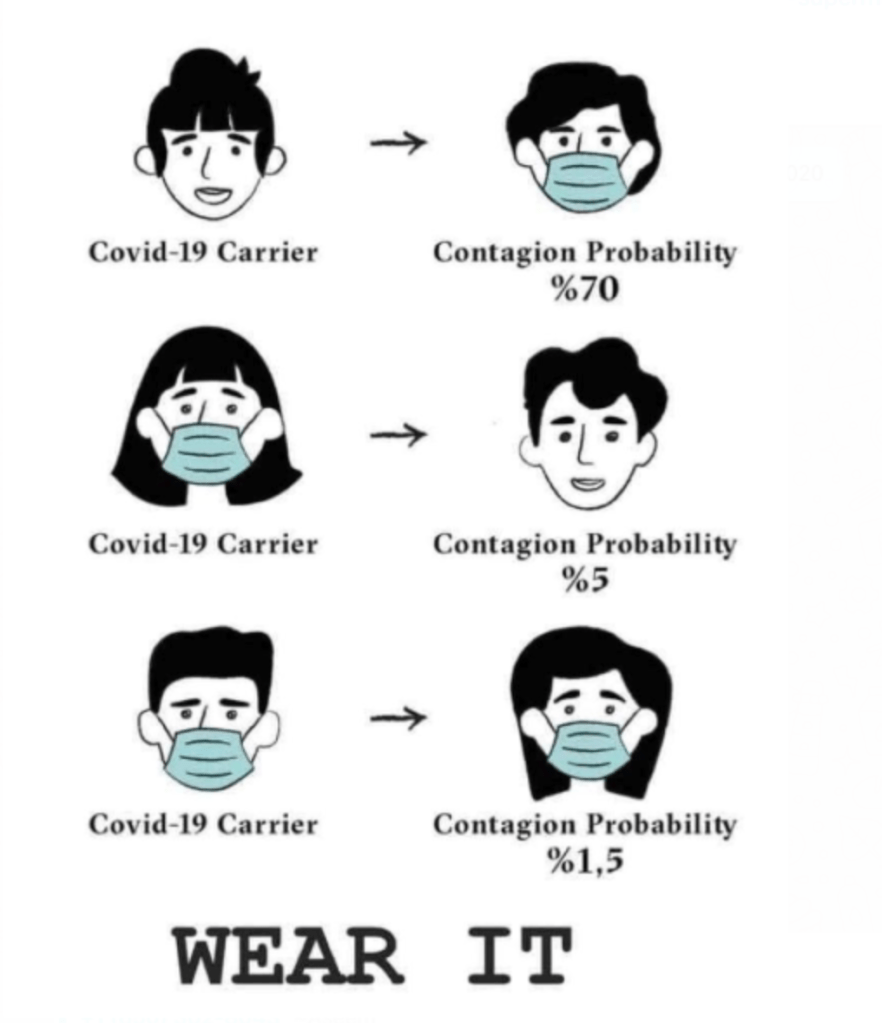
First, the post that started it all. Many of you may have seen this public health poster (or a similar version of it). One of the more curious guys in the college group wanted to know if the math on the probabilities was accurate?
And needless to say, several of us got into the discussion – slugged it out with each other in smaller groups. Without digressing into the argument, two key takeaways before we move on.
It is obvious that these probabilities are not multiplicative: i.e. just because the 3rd case (both masks) appears to be an ‘AND’ condition of the 1st and 2nd, you don’t get to multiply the probabilities. For the simple reason that event-1 and event-2 are NOT independent events. One of the most common fallacies in probability.
- And so, the next question: how do you arrive at these probabilities? The natural answer is observations: record enough observations of all these 3 scenarios and for each scenario, calculate the ratio of positive cases to the total observations. And as you keep getting more and more observations, you can even try to generalize this into distributions and use that to get better at generalizing this for the population (with confidence intervals – remember the frequentists?!). That sounds all logical and right, but there is a fundamental flaw here: how do you get all of those observations? It is not that we have experiments going on or tracking these types of contact scenarios in a structured way. How then can you hope to quantify such scenarios?
The need to model real-world scenarios and make predictions without the benefit of structured observations is not a new problem – in fact, epidemiologists around the world are working very hard to answer several questions that will end up having far-reaching consequences on the economic recovery and public health policies.
Which begs the question – why haven’t organizations explored the idea of mathematical models for decision support? Over the last few years, there has been huge adoption of statistical models as a decision support tool – driven largely by the trifecta of data, compute power and widespread availability of statistical models. And built on a fundamental assumption that the past is the most reliable predictor of the future: and if you have enough observations, you can build statistical models to make reasonable predictions for the future.
Which all works fine – until, you guessed it, we run into situations that have never been seen before. Take the banking sector: all the current models of consumer risk, product pricing, operations risk et al. are going to be unreliable for the foreseeable future. There is no point even trying to re-calibrate the models: the obvious reason being that there is no historical data to train these models. What then a bank, which has probably invested heavily in building data science teams to do? Before we answer that, a quick diversion into the foundations of the data science industry and how we may have missed one whole, very important part in our current fascination with AI/ML.
Probability or Statistics?
Let’s first get some fundamental concepts out. You can skip this if you are the impatient variety – but I would recommend you take time to reflect on these concepts.
This starts with the notion of a ‘Collective’ where members are distinguished by certain attributes. Think customers with a set of demographics (age, income etc.) and behavioral (purchase history, online visits etc.) attributes. We know of the probabilities attached to different attributes in a Collective as their ‘distribution’.
The Theory of Probability: Probability is the process of deriving new, generalized notions of the Collective and using that to make predictions from given distributions in one more initial Collective. Basically, what this means is: use initial intuitive or conceptual (apriori) understanding of the attributes to build a mathematical model that can infer the probability of future events. For instance, we could start with an intuition that the probability of a loan installment default follows a power law distribution. This is either a pure conjecture (not usually) or an underlying behavioral feature of how credit customers respond to extreme shocks based on similar (not necessarily exact) events in the past.
Statistics: Statistics is the investigation of empirical data to investigate whether and to what extent they can be interpreted as collectives or reduced to collectives. It can be thought of as the ‘investigation of large numbers’ or ‘study of frequencies’. What this means is: rely on observations to understand the underlying behaviors. And so, it follows that the more data you have, better your understanding of your subjects and their attributes.
So, in essence, probability is all about: given a data generating process, can we predict the outcome and its underlying properties? Statistical inference is: given the outcomes, what can we infer about the process that generated the data?
What does all this mean?
Back to the poster. I don’t know if there was really a mathematical model behind these numbers. At the very least, we would need 3 different models one for each scenario. And each model would use ‘factors’ like the efficacy of the masks, social distance etc. to derive a functional form using these factors to derive the probability of an individual contracting the virus. There is a lovely little article on a very similar topic: an infection risk estimator : in the absence of statistical data, the author builds a probabilistic mathematical model to estimate the probability of catching the virus under different circumstances. And then simulates the probability under different scenarios – while these may not be accurate, they give a very good directional sense on how to make decisions. Definitely worth a detailed read.
What next?
I think that there is a strong case to be made for re-imagining how we have been thinking about data science as we fumble through this increasingly VUCA (Volatile, Unpredictable, Complex and Ambiguous) world:
- Organizations need to add the ability to do mathematical modeling in their arsenal. Decision support in this world of limited/no data needs to go beyond statistical inference. And the application of models should go beyond modeling policy questions (e.g. what is the optimal spread across a bank’s loan portfolio to maximize ROI) to operational questions (e.g. what is the probability of a customer missing her next loan installment?)
- Data Science teams need to supplement the statisticians with capabilities that can build mathematical models ground-up and use them to run simulations for evaluating alternatives. We could learn a thing or two from epidemiologists and physicists.
- While organizations should continue to invest in building meaningful data assets and ML tools, there needs to be a strong focus on Simulation technologies. These are usually very compute intensive, but an absolutely worthwhile investment.
So here we are: in the previous post, we made the case for Simulation – this week, the focus was on building the capability to truly design and implement Simulation based systems, especially in low/poor data ecosystems.
It is obvious that this is a rich area with lots of tremendous research and thinking over the last 400 years. I have not even scratched the surface.
Suggested Reading:
- An old book: ‘Proability, Statistics and Truth’ by Richard Von Mises. A bit dense but beautifully lays out the fundamentals of probability and statistics. Worth going back to the basics, especially if data science and analysis is your thing
- Trivia on the creation of the Theory of Probability – very short read: http://homepages.wmich.edu/~mackey/Teaching/145/probHist.html

Leave a comment