Thales of Miletus was a Greek mathematician and a pre-Socratic philosopher, generally regarded as the first philosopher on the Greek tradition. And here’s an interesting story about him: he predicted the weather and a good olive harvest for a particular year. He went a step further and reserved all the olive presses in advance at a discount, and when the harvest season did come around and the demand for olive presses peaked, he rented them out at a premium and made a tidy profit. Thales later said that this was in response to a challenge by someone who had asked why, if Thales was such an ‘intelligent philosopher, why wasn’t he rich?’ Thales wanted to prove to the world that philosophy could be useful, and in this case, make him a lot of money! You have to give it to the Greek philosophers – they were coming up with interesting ideas all the time. The original thinkers and more importantly, tinkerers.
What makes this particular story interesting is that this is the first recorded example of an option – how Thales saw an ‘extreme’ event and bet on it while everyone else expected a ‘normal’ scenario to play out. In a normal distribution, about 99.7% of observations fall within 3 standard deviations of the mean – in other words, you would think there is a 0.3% chance of an extreme event happening. And the world as we know it, is anything but normal – and the events over the last 3 months have underscored how far and rapidly we are moving away from a world where we could get by with the simplifying assumptions of a normal (i.e. Gaussian) distribution. And if you have anything remotely to do with managing risk (who among is not?), it is time to open the hood and start going back to the fundamentals of how we think about decision making, and how we use data to inform us in our decision-making process. What happened in the arcane world of finance in the late 20th century when the quants exploited their ability to spot ‘rare’ events using data is now going mainstream – from managing customer risk if you are a consumer bank to managing supply chain inventories if you are a retailer, you can no longer rely on some of these simplifying assumptions.
Let’s start with what is one of the most commonly used assumptions in Analytics: sample data as representative of the population. We cannot get away from working with sample data – the question really, is how much of a sample size is good enough? Here’s a simple example of two distributions: Gaussian (normal) and Pareto (Power laws are classic fat-tail distributions)
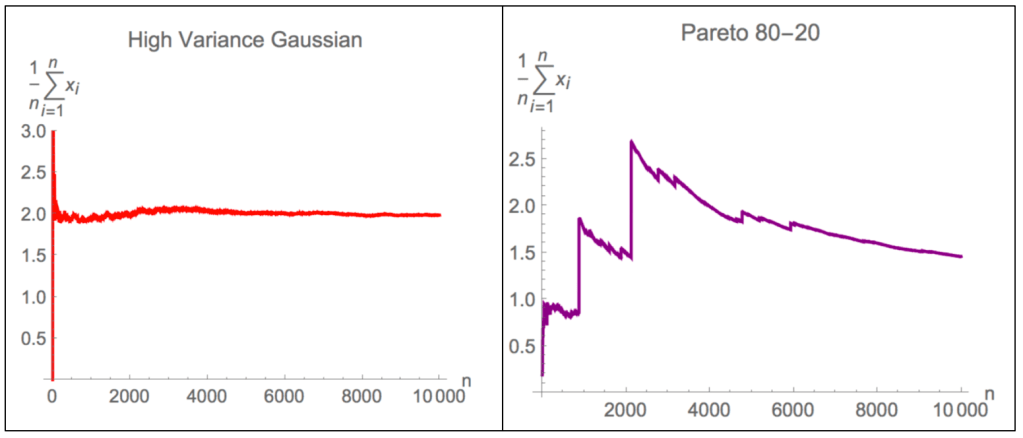
It is obvious that as with an increase in the number of observations (X-axis), while the sample mean (Y-axis) in a Gaussian distribution converges nicely and stabilizes, the Pareto distribution is a lot ‘choppier’ and takes a much larger sample size to stabilize. And if you think about it, it is intuitive – rare events are, well, rare and require a lot of data to show up.
So, what does this mean?
- In real life, for your observation datasets for analysis to be truly informative, you need lots more (in cases, orders of magnitude) data. In a sense, the data that you need increases with the complexity of your business environment. And it is not just about the volume of data – you need to ensure that the datasets capture as many scenarios as possible: the variety is just as important. Putting it more formally, in a non-normal distribution, the tail events will end up impacting metrics like the Mean and Standard Deviation in a much more significant manner.
- And a natural consequence of this: a ‘one size fits all’ model that seeks to predict, say, the propensity for a customer to default on a credit product will fail spectacularly when it comes to any tail-events. Most risk evaluation approaches have become granular over the years (e.g. customer default-risk models are typically built at a segment and product level) – but will they really work when it comes to systemic tail events? Leave alone an extreme tail event that we are currently in right now.
- Which leads us to the main issue that we must address: with limited (if any at all) observations of tail events to learn from, how do you build a decision support system that could be useful to give at least an early warning, if not predict a tail-event? More on that later.
Here are some useful links:
- If you are interested and have the time (and time is one thing you probably have right now), here is a book worth taking a look: https://en.wikipedia.org/wiki/Antifragile by Nassem Taleb. It is definitely not a cursory read (none of his books are) and if you are the hardy variety, attempt his entire series on Uncertainty (opaquely titled ‘Incerto’)
- Networks (e.g. social, and the internet itself) tend to follow power-law distributions. And there is a school of thought that as the world becomes more inter-connected, the power-law might even become an emergent property of the physical world around us. Clay Shirky is one of the leading purveyors of this school http://extremedemocracy.com/chapters/Chapter%20Three-Shirky.pdf
- What it feels to be living through an extreme event. Here’s a tongue-in-cheek, but brilliant list of how things are changing around us: https://marginalrevolution.com/marginalrevolution/2020/04/world-2-0-there-are-decades-where-nothing-happens-and-weeks-where-decades-happen.html
